

Auto Financing · Cost Analysis
84-Month Auto Loan: The Real Cost by Credit Tier
Most US auto financing is now presented to buyers as a monthly payment, not a total cost. That framing matters: in Experian’s Q4 2025 State of the Automotive Finance Market report, nearly a third of new-vehicle loans (31.78% of the market) carried terms of 73 months or longer. Choosing 84 months over 60 months at the same APR keeps the same vehicle on the road for two more years of interest accrual. How much that costs depends entirely on the credit tier the borrower qualifies for — and the dollar penalty grows sharply as APR rises.
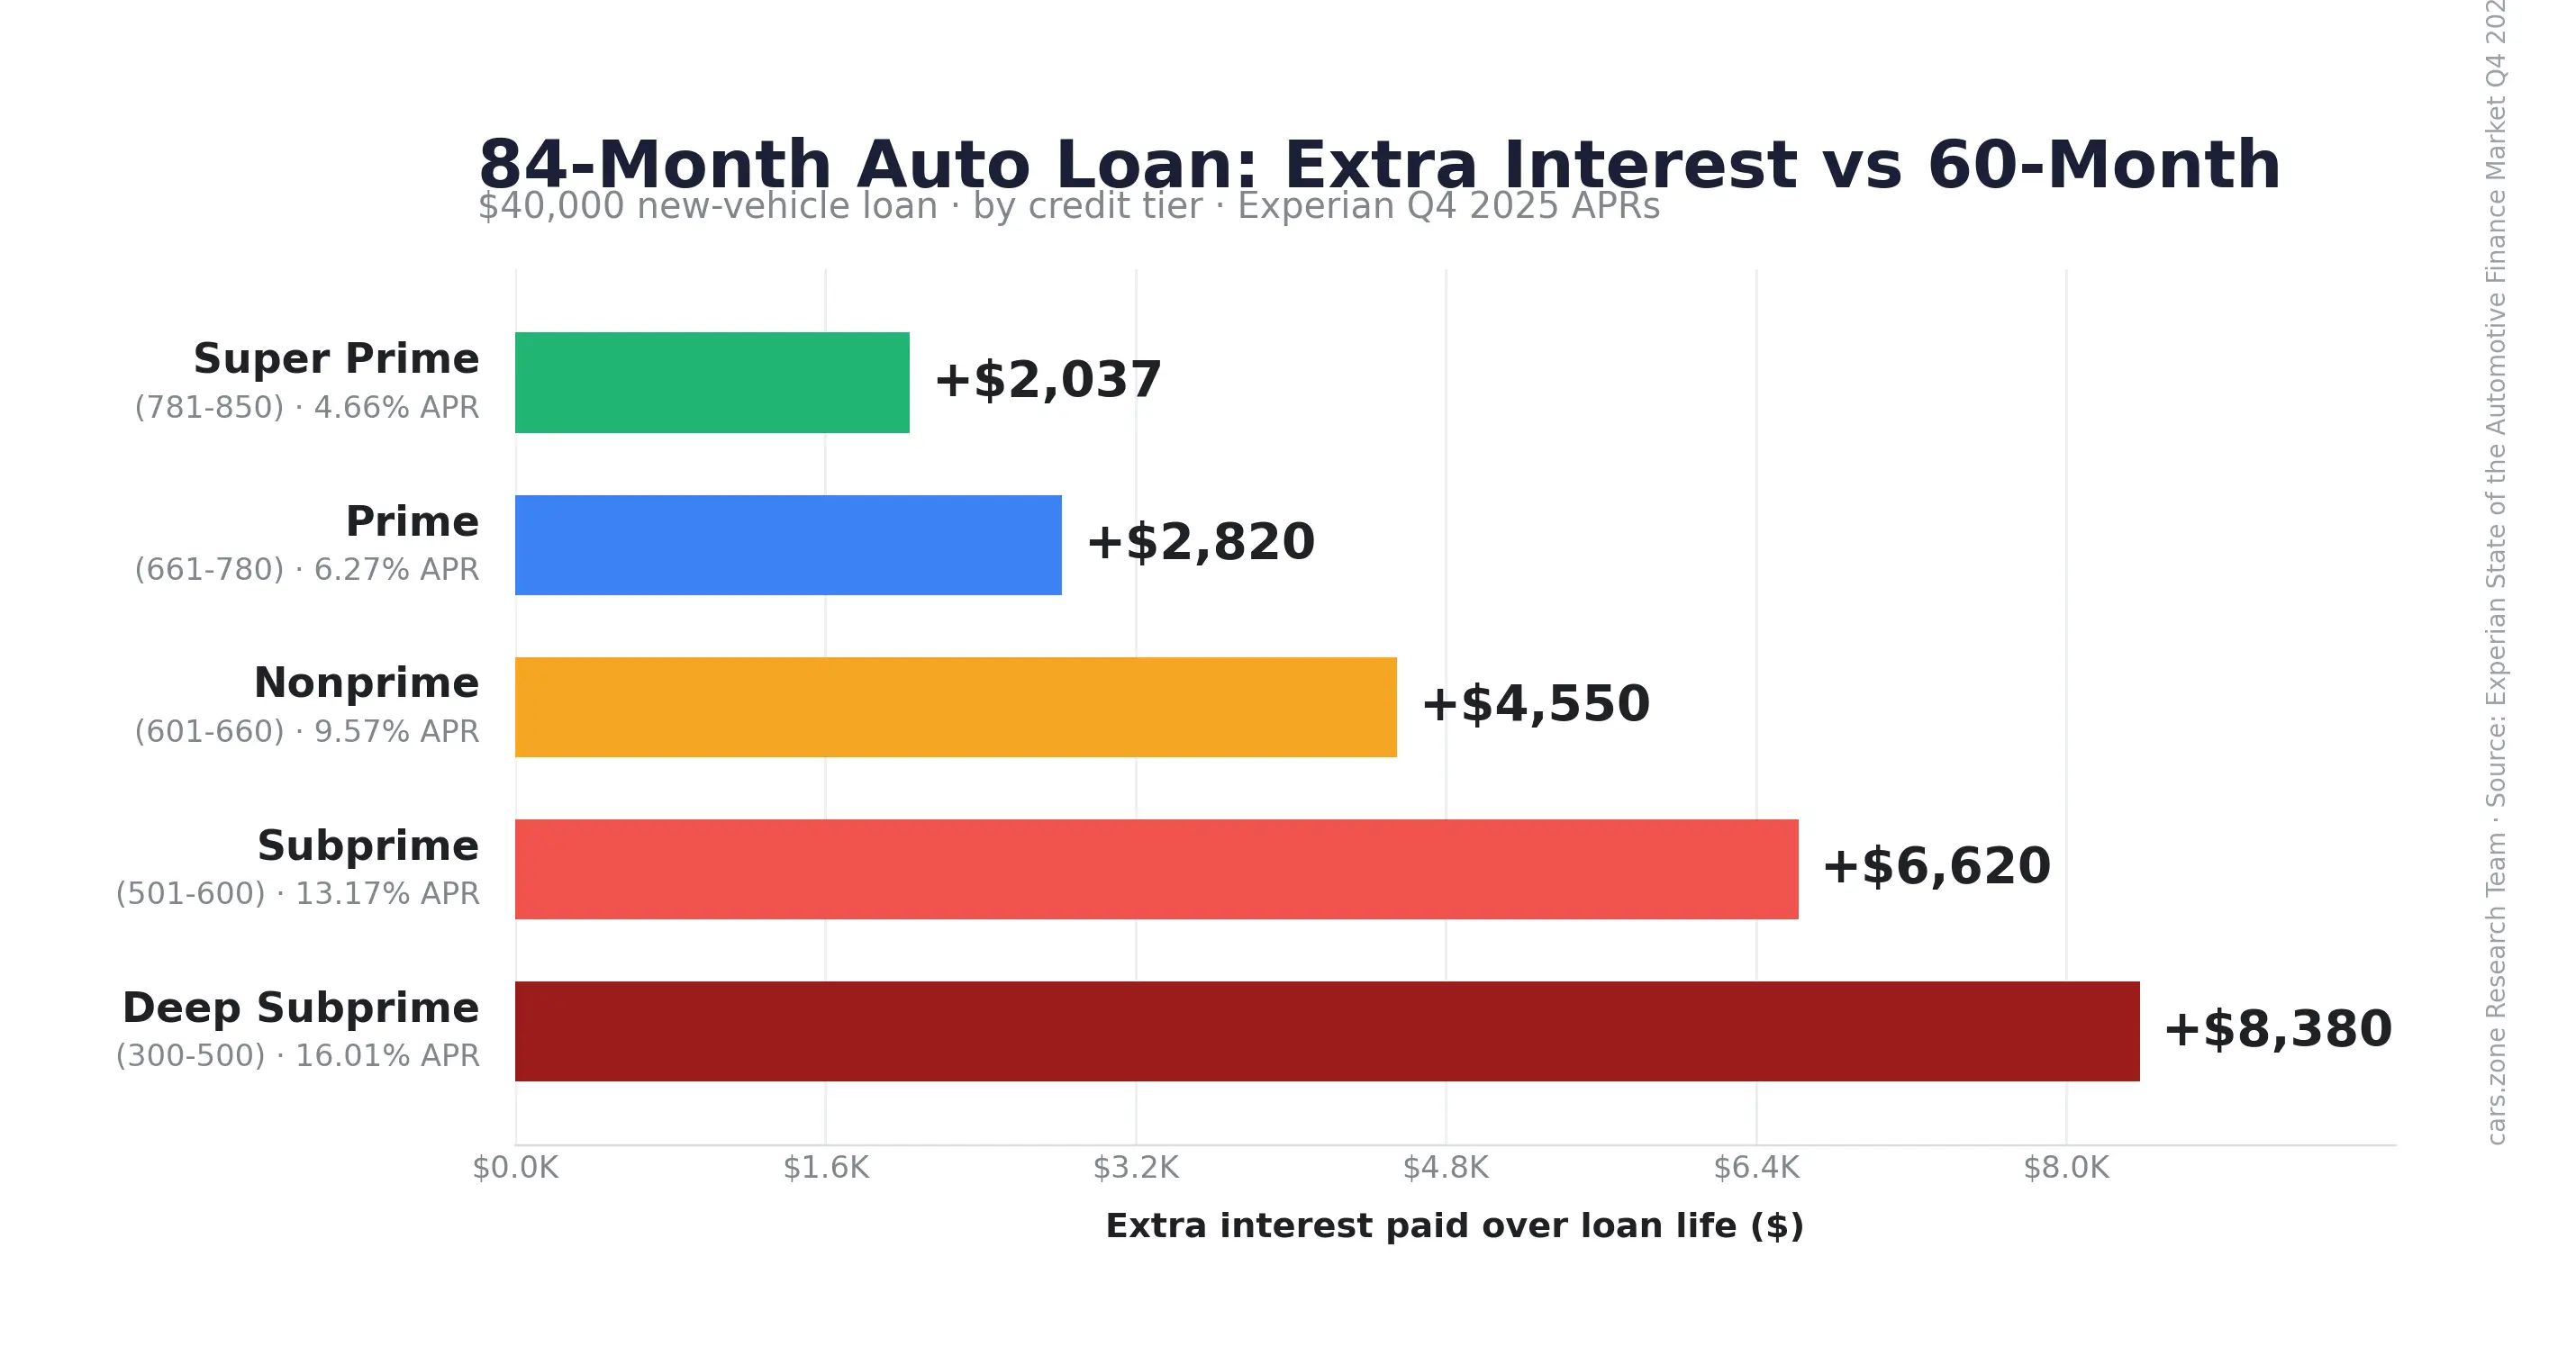
An 84-month auto loan costs between $2,037 and $8,380 more in total interest than a comparable 60-month loan, depending on credit tier. On a $40,000 loan at Experian’s Q4 2025 Prime average APR (6.27%), the 84-month term costs $9,521 in interest versus $6,701 for 60 months — about $2,820 more — while lowering the monthly payment by only ~$190. The longer term trades thousands in extra interest for a modest monthly saving. Figures: Experian SAFM Q4 2025.
This article computes the exact difference, by tier, using Experian’s published Q4 2025 average APRs for new vehicles and a standard amortization formula.
Educational estimates from public data. Get personalized quotes from lenders for actual loan offers.
What is the real cost of an 84-month auto loan?
On a $40,000 vehicle financed at Experian’s Q4 2025 Prime-tier average APR (6.27%), an 84-month loan costs $9,520.81 in total interest versus $6,700.63 on a 60-month loan. The longer term lowers the monthly payment by $188.81 but adds $2,820.18 in total interest over the life of the loan. Across all five Experian credit tiers, the 84-vs-60 interest penalty on a $40,000 loan ranges from $2,036.93 (Super Prime) to $8,379.58 (Deep Subprime).
How an 84-month auto loan works and why it’s now mainstream
An 84-month auto loan is a seven-year financing agreement to buy a new or used vehicle. Mechanically it differs from a shorter loan in two ways: the monthly payment is lower because the principal is spread over more periods, and the total interest paid is higher because there are more periods for interest to compound on the unpaid balance.
The term has moved from fringe to mainstream over the last decade. In Experian’s Q4 2025 data, the share of new-vehicle loans by term bucket breaks down as follows:
| Term bucket | Q4 2025 share of new-vehicle loans |
|---|---|
| 1–48 months | 10.68% |
| 49–60 months | 20.23% |
| 61–72 months | 37.30% |
| 73–84 months | 29.56% |
| 85+ months | 2.22% |
The 61–72 month bracket is the modal choice; the 73–84 month bracket has climbed to nearly a third of all new-vehicle loans. Combined, loans of 73 months or longer accounted for 31.78% of new-vehicle financing in Q4 2025 — meaning more than one in four buyers commits to a loan that exceeds six years.
The shift toward longer terms has not been driven by a single factor. Experian’s Q4 2025 report shows the average new-vehicle loan amount reached $43,582 and the average monthly payment reached $767 — both record highs. Lengthening the term is one of the few levers a buyer can pull to keep the monthly payment within a household budget when vehicle prices and APRs are both elevated. The trade-off is the question this article answers.
The interest cost by credit tier
Executive finding
Across all five Experian credit tiers, choosing an 84-month term over a 60-month term on a $40,000 new-vehicle loan adds between $2,037 (Super Prime) and $8,380 (Deep Subprime) in total interest. The dollar penalty generally increases as APR rises — meaning the borrowers most likely to need the lower monthly payment are also the borrowers who pay the steepest premium for it. The monthly payment difference between the same two terms is roughly $190 (Super Prime) to $180 (Deep Subprime) — narrower than most buyers expect, because the late-term payments on a longer loan are heavily weighted toward interest.
- Standard amortization formula
- No fees or origination costs
- No sales tax
- No down payment (loan amount = full principal financed)
- APR held constant across all three term lengths
The math, by tier
The table below uses a fixed $40,000 loan amount across all tiers so the cells are directly comparable. APRs are Experian’s published Q4 2025 averages by VantageScore 4.0 tier . Results scale proportionally for larger or smaller loan amounts (a $30,000 loan produces 75% of the interest figures shown; a $50,000 loan produces 125%).
60-month term
| Credit tier (VantageScore) | APR (Q4 2025) | Monthly payment | Total interest |
|---|---|---|---|
| Super Prime (781–850) | 4.66% | $749.92 | $4,995.20 |
| Prime (661–780) | 6.27% | $778.34 | $6,700.63 |
| Near prime (601–660) | 9.57% | $841.43 | $10,485.55 |
| Subprime (501–600) | 13.17% | $913.94 | $14,836.43 |
| Deep Subprime (300–500) | 16.01% | $972.96 | $18,377.69 |
72-month term
| Credit tier (VantageScore) | APR (Q4 2025) | Monthly payment | Total interest |
|---|---|---|---|
| Super Prime (781–850) | 4.66% | $639.30 | $6,029.84 |
| Prime (661–780) | 6.27% | $668.05 | $8,099.43 |
| Near prime (601–660) | 9.57% | $732.39 | $12,732.07 |
| Subprime (501–600) | 13.17% | $806.74 | $18,085.18 |
| Deep Subprime (300–500) | 16.01% | $867.78 | $22,480.00 |
84-month term
| Credit tier (VantageScore) | APR (Q4 2025) | Monthly payment | Total interest |
|---|---|---|---|
| Super Prime (781–850) | 4.66% | $560.74 | $7,102.13 |
| Prime (661–780) | 6.27% | $589.53 | $9,520.81 |
| Near prime (601–660) | 9.57% | $655.18 | $15,035.25 |
| Subprime (501–600) | 13.17% | $731.78 | $21,469.93 |
| Deep Subprime (300–500) | 16.01% | $795.21 | $26,797.27 |
All values calculated using standard amortization against Experian Q4 2025 published tier APRs. No fees, taxes, or down payment in this example — the figures isolate the cost effect of term length alone.
Key findings at a glance
| Finding | Result |
|---|---|
| Smallest 84-vs-60 interest penalty | Super Prime: +$2,036.93 |
| Largest 84-vs-60 interest penalty | Deep Subprime: +$8,379.58 |
| Typical Prime-tier penalty | +$2,820.18 |
| Monthly payment reduction (60 → 84) | ~$180–190/month across all tiers |
| 73–84 month share of new-vehicle market (Q4 2025) | 29.56% (31.78% including 85+) |
| Underwater share of trade-ins, Q4 2025 / Q1 2026 (Edmunds) | 29.3% / 30.9% |
| Equity recovery, $40K Prime 6.27% APR (illustrative) | 60-month: ~18 months. 84-month: ~36 months. |
Extra interest by credit tier — the headline number
| Credit tier | Extra interest, choosing 84 months over 60 months |
|---|---|
| Super Prime | $2,036.93 |
| Prime | $2,820.18 |
| Near prime | $4,549.70 |
| Subprime | $6,619.50 |
| Deep Subprime | $8,379.58 |
All figures: $40,000 new-vehicle loan, Experian Q4 2025 average APR by VantageScore 4.0 tier, no fees or down payment.
The 84-vs-60 trade-off, by tier
The full decision in one row per credit tier: what you save monthly versus what you pay extra in total interest.
| Credit tier | Monthly payment saved (60 → 84) | Extra total interest paid |
|---|---|---|
| Super Prime | $189.65/mo | $2,036.93 |
| Prime | $188.81/mo | $2,820.18 |
| Near prime | $186.25/mo | $4,549.70 |
| Subprime | $182.23/mo | $6,619.50 |
| Deep Subprime | $178.22/mo | $8,379.58 |
What the math shows
For a Super Prime borrower, the $2,037 difference between 60 and 84 months is roughly 5.1% of the original loan amount. For a Deep Subprime borrower, the equivalent $8,380 difference is 20.9% of the original loan amount. The interest penalty for stretching the term is therefore not just larger in dollars for higher-APR borrowers — it is more than four times larger as a share of the loan. A Prime borrower, the largest single segment of the market by share, pays an extra $2,820 over the life of the loan by choosing 84 months instead of 60.
The monthly payment savings, by contrast, are similar across tiers: a Super Prime borrower saves $189.31 per month by choosing 84 over 60; a Deep Subprime borrower saves $180.51. That narrow range reflects the underlying amortization math — the longer the term, the smaller the share of each payment that goes to principal, regardless of APR.
Why dealerships present 84-month financing
Auto financing is most often presented at the dealership as a monthly payment, not a total cost. A buyer with a fixed monthly budget can afford a meaningfully more expensive vehicle on an 84-month loan than on a 60-month loan at the same APR — that is the structural reason the 73–84 month bracket has settled at roughly a quarter of the new-vehicle market.
The longer term is not, in itself, a poor decision. It becomes a poor decision when the lower payment is the only number used to evaluate affordability, because the extra months of interest are the cost the payment view does not show. A Prime borrower choosing 84 months over 60 months saves $188.81 per month — and pays $2,820.18 more in total interest. The savings are real; so is the cost. They are different numbers measuring different things.
The clean test, before signing a longer-term loan: would the same vehicle be affordable at the 60-month payment for that purchase price? If yes, the longer term is a cash-flow choice rather than a stretch. If no, the longer term is masking a vehicle that is outside the buyer’s actual price range — and the math above shows what that masking costs.
The negative-equity association
A separate body of data tracks what happens when a buyer trades in a vehicle while still owing more than it is worth — a position commonly called negative equity or being underwater. The numbers come from Edmunds, which publishes a quarterly Insights Report on the new-vehicle trade-in market.
In Q4 2025, 29.3% of trade-ins toward new-vehicle purchases were underwater. The figure rose to 30.9% in Q1 2026. Of the buyers who rolled negative equity into a new loan in Q4 2025, 40.7% financed the new loan over 84 months; the figure rose to 43% in Q1 2026 for the 84-month-or-longer bracket. The average amount of negative equity carried into the new loan was $7,214 in Q4 2025 and $7,183 in Q1 2026 — and a record 27% of underwater trade-ins in Q4 2025 carried five-figure negative equity ($10,000 or more), with 9.2% carrying more than $15,000.
The relationship between 84-month financing and negative equity is associative, not causal — the longer term does not by itself create negative equity, but the same buyer characteristics (payment-constrained budget, smaller down payment, higher initial loan-to-value) tend to produce both choices. The mechanic that links them is the slow rate at which 84-month loans amortize relative to standard vehicle depreciation.
The table below models the equity position of a $40,000 Prime-tier loan at 6.27% APR across three term lengths. Vehicle value uses a representative depreciation curve disclosed below the table.
Loan balance by term length
| Month | 60-mo loan balance | 72-mo loan balance | 84-mo loan balance |
|---|---|---|---|
| 6 | $36,588 | $37,258 | $37,735 |
| 12 | $33,057 | $34,421 | $35,391 |
| 18 | $29,403 | $31,485 | $32,965 |
| 24 | $25,621 | $28,446 | $30,454 |
| 36 | $17,659 | $22,048 | $25,168 |
| 48 | $9,132 | $15,196 | $19,507 |
Equity position vs vehicle value
Negative values indicate the buyer owes more than the vehicle is worth (underwater).
| Month | Vehicle value | Equity (60-mo) | Equity (72-mo) | Equity (84-mo) |
|---|---|---|---|---|
| 6 | $36,000 | −$588 | −$1,258 | −$1,735 |
| 12 | $32,000 | −$1,057 | −$2,421 | −$3,391 |
| 18 | $30,400 | +$997 | −$1,085 | −$2,565 |
| 24 | $28,800 | +$3,179 | +$354 | −$1,654 |
| 36 | $25,920 | +$8,261 | +$3,872 | +$752 |
| 48 | $23,328 | +$14,196 | +$8,132 | +$3,821 |
$40,000 loan, no down payment, 6.27% APR (Experian Q4 2025 Prime new-vehicle average). Vehicle depreciation modeled at 20% in Year 1, 10% in Year 2, and 10% compounding annually thereafter — a curve broadly consistent with Kelley Blue Book’s published guidance that a typical new car loses approximately 30% of its value in the first two years. Actual depreciation varies materially by model and trim; this curve is illustrative.
- 60-month loan: crosses to positive equity at approximately month 18 (net equity: +$997)
- 72-month loan: crosses to positive equity at approximately month 24 (net equity: +$354)
- 84-month loan: crosses to positive equity at approximately month 36 (net equity: +$752)
The pattern: under these assumptions, the 60-month buyer crosses out of negative equity at approximately month 18; the 72-month buyer crosses at approximately month 24; the 84-month buyer crosses at approximately month 36. With a higher APR, a smaller down payment, or steeper depreciation (common in luxury and EV segments), the 84-month buyer’s crossover point moves later. With a 20% down payment, all three buyers start with positive equity and the order does not change, but the crossover-to-positive moves earlier for each.
New vs used at 84 months: the used penalty
The interest cost of an 84-month term is materially higher for used vehicles than for new ones. Experian’s Q4 2025 data shows the national average APR was 6.37% for new vehicles and 11.26% for used vehicles. Across tiers, the gap is consistent: the used-vehicle APR runs roughly 304 to 625 basis points above the matching new-vehicle tier APR.
| Credit tier | New APR (Q4 2025) | Used APR (Q4 2025) | APR gap |
|---|---|---|---|
| Super Prime | 4.66% | 7.70% | +3.04 pp |
| Prime | 6.27% | 9.98% | +3.71 pp |
| Near prime | 9.57% | 14.49% | +4.92 pp |
| Subprime | 13.17% | 19.42% | +6.25 pp |
| Deep Subprime | 16.01% | 21.85% | +5.84 pp |
The effect on an 84-month used loan is large. A Prime-tier buyer financing $25,000 on a used vehicle at 9.98% APR for 84 months pays $9,840.68 in total interest — $2,985 more than the same $25,000 loan over 60 months. A Subprime-tier buyer financing the same $25,000 used loan at 19.42% APR for 84 months pays $20,902.64 in total interest — more than 80% of the original loan amount, and $6,645 more than the same loan over 60 months.
A common shopper assumption is that buying used always costs less than buying new. At 84 months, the APR gap can invert that — a higher-tier buyer financing a used vehicle at 84 months may pay more in lifetime interest than a Super Prime buyer financing a comparable new vehicle at 60 months. The total-cost comparison depends on the exact prices and APRs; the point is only that the used-loan APR is the variable most often underweighted in the new-versus-used decision. For the broader new-versus-used calculus, see New vs Used Car Total Cost Analysis for US Buyers.
Situations where buyers choose 84-month financing
Direct answer: An 84-month auto loan is a defensible choice in three specific situations — long planned ownership, sufficient down payment plus trade-in to offset depreciation, or a plan to make extra principal payments. Outside those conditions, the cost data argues against it.
The published data does not support a categorical statement that 84-month financing is always the wrong choice. There are conditions under which an 84-month term is a defensible cash-flow decision rather than an avoidable cost.
Long planned ownership. A buyer who intends to keep the vehicle through and beyond the full 84-month term faces no negative-equity risk at trade-in, because there is no trade-in. The extra interest is the cost of spreading the payment over the longer period — the buyer pays it knowingly, and the depreciation curve and amortization curve eventually intersect well before the loan ends.
Down payment plus trade-in covers expected depreciation. A buyer who puts 15–20% down on a new vehicle and has a clean trade-in starts the loan with materially less initial loan-to-value. Under those conditions the 84-month buyer can stay in positive equity throughout the loan term, particularly on a vehicle with slower-than-average depreciation.
Planned extra-principal payments. A buyer who treats the contract term as a ceiling and pays extra to principal each month effectively shortens the loan. Confirming the loan has no prepayment penalty (federal law does not bar prepayment penalties on auto loans, though most current US auto loans do not include them) is a one-question precondition.
These conditions reduce some of the risks associated with long-term financing, but the trade-off between lower payments and higher lifetime interest remains.
How to reduce the cost if already in an 84-month loan
A buyer already partway through an 84-month loan has three options for reducing the total cost, each with a different math signature.
Pay extra to principal. Any extra payment applied to principal reduces the balance that future interest accrues against. The arithmetic effect is large: on the $40,000 Prime example above, adding $100/month in extra principal payments shortens the 84-month term by approximately 14 months and reduces total interest paid by roughly $1,700. The result is a 70-month payoff at the original APR with no refinance required.
Refinance to a shorter term. A buyer whose credit has improved since origination — or whose APR was inflated at the time of purchase — can refinance into a shorter term at a lower APR. The break-even calculation is straightforward: the new term’s total interest must be lower than the remaining interest on the existing loan by more than any refinance fees. Most US auto-loan refinances have no origination fee, making the break-even point shallow.
Sell the vehicle. If the loan balance is below the vehicle’s current market value, the buyer can sell, pay off the loan, and exit. If the loan balance is above the vehicle’s value (negative equity), selling requires the buyer to cover the gap in cash; rolling the gap into a new loan moves the same debt forward rather than reducing it.
Frequently Asked Questions
An 84-month auto loan adds between $2,036.93 (Super Prime) and $8,379.58 (Deep Subprime) in total interest on a $40,000 new-vehicle purchase compared to a 60-month term, based on Experian Q4 2025 average APRs by VantageScore 4.0 credit tier.
An 84-month loan at the Experian Q4 2025 Prime-tier average APR of 6.27% costs $2,820.18 more in total interest than a 60-month loan on a $40,000 new-vehicle purchase ($9,520.81 vs $6,700.63).
Experian’s Q4 2025 average APRs for new vehicles by credit tier are 4.66% (Super Prime), 6.27% (Prime), 9.57% (Near prime), 13.17% (Subprime), and 16.01% (Deep Subprime). The national new-vehicle average across all tiers was 6.37% in Q4 2025. Term-specific APRs above 72 months are typically priced at a small premium to shorter-term APRs at the same credit tier.
31.78% of new-vehicle loans in the United States use a term of 73 months or longer, per Experian Q4 2025 data: 29.56% in the 73–84 month bracket plus 2.22% at 85+ months.
Experian’s tier scheme (VantageScore 4.0) places Super Prime at 781–850, Prime at 661–780, Near prime at 601–660, Subprime at 501–600, and Deep Subprime at 300–500. The lowest published Q4 2025 new-vehicle APR was 4.66% for Super Prime borrowers; the highest was 16.01% for Deep Subprime. All five tiers appear in Experian’s 84-month loan distribution, meaning the term is available across the full credit spectrum — but pricing tightens significantly at lower tiers.
A 72-month loan costs $1,398.62 less in total interest than an 84-month loan at the Experian Q4 2025 Prime-tier APR of 6.27% on a $40,000 loan ($8,099.43 vs $9,520.81), with a monthly payment $78.52 higher ($668.05 vs $589.53). The 72-month term also builds positive equity roughly 12 months sooner under standard depreciation.
There is no universal maximum term. The cost difference between 60, 72 and 84 months depends on APR, down payment, depreciation, and ownership horizon. The published Experian Q4 2025 data shows that total interest cost rises materially as term length increases — a Prime-tier $40,000 loan at 6.27% APR pays $6,701 in interest over 60 months versus $9,521 over 84 months. The right term length is the shortest one whose monthly payment fits the buyer’s budget without crowding out other obligations.
Experian’s Q4 2025 data shows the active new-vehicle loan term distribution: 10.68% at 1–48 months, 20.23% at 49–60, 37.30% at 61–72, 29.56% at 73–84, and 2.22% at 85+ months. The 61–72 month bracket is the most common; 73 months and longer combined account for 31.78% of new-vehicle financing.
Under a representative depreciation model (20% Year 1, 10% Year 2, 10% annually thereafter) applied to a $40,000 Prime-tier loan at 6.27% APR with no down payment, the 84-month buyer crosses out of negative equity at approximately month 36. The equivalent 60-month buyer crosses at approximately month 18. The crossover point moves later with higher APR, smaller down payment, or steeper depreciation.
Auto financing is most often presented in monthly-payment terms. A longer term reduces the monthly payment at any given vehicle price, which increases the vehicle price band the dealer can present to a buyer with a fixed monthly budget. The mechanic is structural rather than promotional — the same math applies at any lender — and the higher total cost of the longer term is not visible in the monthly-payment view.
Quick answers
| Question | Short answer |
|---|---|
| Is 84 months a common loan term in the US? | Yes. 29.56% of new-vehicle loans were 73–84 months in Q4 2025; 31.78% were 73+ months (Experian). |
| Is 84 months cheaper than 60 months? | No. Total interest is higher at every credit tier. |
| Does 84 months lower the monthly payment? | Yes. Roughly $180–190/month lower than 60 months on a $40,000 loan. |
| Does 84 months increase negative-equity risk? | Associated with it. 40.7% of Q4 2025 underwater trade-ins used 84-month financing (Edmunds). |
| What APR should a Prime borrower expect? | 6.27% on new vehicles, 9.98% on used (Experian Q4 2025). |
| How much extra interest at Prime tier, 84 vs 60? | $2,820.18 on a $40,000 loan. |
Sources and methodology
Primary sources:
- Experian, State of the Automotive Finance Market — Q4 2025 (Melinda Zabritski, Head of Automotive Financial Insights, Experian Automotive). Accessed 2026-05-08. APR-by-tier, term-distribution, and loan-amount data from this report.
- Edmunds, Q4 2025 Insights Report (January 2026) and Q1 2026 Insights Report (April 2026). Negative-equity statistics.
- Federal Reserve, G.19 Consumer Credit release (TERMCBAUTO48NS series via FRED, Federal Reserve Bank of St. Louis). National-rate baseline.
Methodology: All monthly-payment and total-interest figures computed via standard amortization using the verbatim Experian Q4 2025 APR-by-tier values. The depreciation curve in the negative-equity table is illustrative, sourced to Kelley Blue Book’s published guidance on first-two-years depreciation; actual depreciation varies by vehicle. For the full methodology, see /methodology/.

About the Author — Ashvin J. Sonani
Founder & Lead Researcher at Cars.Zone. Digital marketer, data analyst, and domain investor with 28+ years of internet experience — from the pre-Google era of Lycos and Altavista through ecommerce operations (2000–2018) to current focus on US automotive cost intelligence. Specializes in extracting actionable conclusions from complex, multi-variable datasets across insurance, depreciation, and total cost of ownership. Cars.Zone analyses are built from primary industry sources (AAA, Kelley Blue Book, Edmunds, iSeeCars, Experian) for core cost data, with select supporting figures such as insurance-by-age sourced from industry aggregators including Bankrate — each figure’s source disclosed and cross-checked before publication. No manufacturer or dealer relationships influence editorial content.